10
Visual Vignettes
Mascha Gugganig and Rachel Douglas-Jones
Visual Vignettes are a method for analysing and presenting research through the integration of text and image. As a format, Visual Vignettes combine the genre of the vignette – widely used across the qualitative social sciences to succinctly capture a telling moment – with that of the photo essay. When we were invited to curate a collection of Visual Vignettes for Sensing In/Security we built on our existing collaborative project, where over the past few years, we have been exploring tools and formats that bring our interest in the visual into research analysis and communication. In the context of this volume, the Visual Vignette becomes a method by which sensing technologies can be differently seen, accessed, and understood, both by analysts and those with whom we as scholars might wish to share our work.
In this chapter we introduce the Visual Vignette, situate it within the shifting grounds of STS’s knowledge infrastructures and discuss its affordances for work in STS. While our project originates in the anthropological embrace of multimodal, imaginative work (Collins, Durrington and Gill 2017, Elliott and Culhane 2017) we put our experimental engagements with analysis and communication of research in conversation with efforts to work across media that are simultaneously gaining prominence in STS (Dányi, Suchman and Watts 2021; Dumit 2017; Jungnickel 2020; Le Bot and Noel 2016). We review the capacities of the Sensing In/Security Visual Vignettes to bring forward critical aspects of our sociotechnical world, and offer a guide for those who might be inspired to experiment with the format themselves.
Knowledge practices, knowledge infrastructures
STS scholarship is rich in borrowed and adapted norms of research, drawing on writing and communication practices from neighbouring disciplines. It is also increasingly inventive. As scholars working at the intersection of anthropology and STS, we are critically aware both of the conditions and implications of how academic knowledge is done, and circulated. Over the past few years, we have both been exploring the possibilities – and constraints – of being inventive with academic methods and formats (Lury and Wakeford 2012). In 2009, for example, Gugganig began to photograph the process of demolishing a building in Vienna, near where she lived and worked. The destruction was taking place as she wrote up her Master’s thesis, prompting an analogy between the scaffolds of structural integrity, and those of successful scholarship. A few years later, building on her reflexive analysis of all the editing, arranging, constructing, rewriting, and deletion that becomes invisible in academia’s end products (see also Boudreault-Fournier 2017), Gugganig created a film of scholarship’s ‘hidden practices’ (2011). Later, in the Visual Vignette format (then called visual essay), she reflected on how these practices are (or are not) part of capacity building in academia (Gugganig 2015; Fig. 10.1 and 10.2).
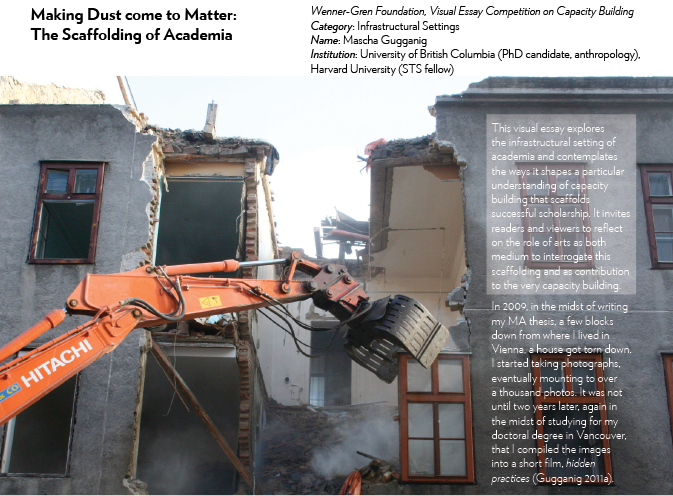
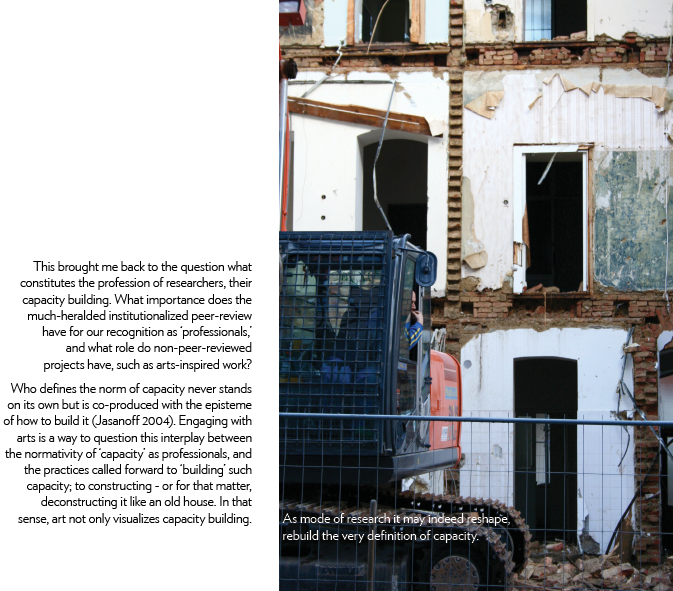
Figs 10.1 and 10.2 Two exemplary frames from Gugganig’s ‘Making Dust come to Matter: The Scaffolding of Academia’ (2015).
Douglas-Jones brought a similarly visual approach to her project of engagement of the General Data Protection Regulation. Academically interested in the politics and technicalities of data deletion pointed to in Article 17 of GDPR (popularized as ‘the right to be forgotten’) she worked with colleagues in Copenhagen and Oxford to create erasure poems from the regulation (Douglas-Jones and Cohn 2018). Erasure poetry – known also as blackout or redaction poetry – was a favoured technique of 1960s radical poets, aesthetic effacement as an ‘additive subtraction’ (Johns, cited in Cage 1967). It rose to public prominence again in 2016 as a form of creative resistance, with poets erasing US application forms and speeches following the election of Donald Trump. As the reporter Stone put it, poems made from bureaucracy ‘re-examine the institutions and narratives that shape American’s lives…reasserting power over language’ (Stone 2017). Inspired by the poet Sarah Howe’s dream of a public art project of doing erasure poetry on Hong Kong’s Basic Law, Douglas-Jones and her colleagues envisaged the emergence of what Howe called ‘subversive, gloriously vulgar undersongs’ (2014: 250) in the GDPR. Deletion became a means for counternarratives to emerge from within the text, not least a critique of the legalese in which it was written. The resulting collection GDPR: Erasure Poems gave voice to interpretive work from the hands of those whose lives the policy affects, and was picked up by over 200 newly appointed Data Protection Officers in Danish and international companies, enlivening GDPR trainings (Fig. 10.3 and 10.4).
How academics conduct, analyse and communicate their research is shaped by disciplinary norms, conventions, funds, schools of thought, and, increasingly, metrics and measurement (Wilsdon 2015; Fochler and de Rijcke 2017). These conditions of possibility are often described as infrastructures of knowledge (Rose and Tolia-Kelly 2012; Star 2002), language that has grown in line with academic attention to infrastructures more broadly. This is not a new conversation. In anthropology, interrogating the underlying mechanisms of scholarly work has been the focus over many generations (Clifford and Marcus 1986; Marcus and Fischer 1986, Pandian and McLean 2017). Beyond that, the publication spaces for interdisciplinary conversation are today reshaping the ways practices might travel across disciplinary borders. As Kat Jungnickel puts it in a recent edited volume encompassing techniques from art, architecture, anthropology, computing, design, media and communications, medieval studies and sociology, ‘[m]any forms and formats have remained relatively unchanged for decades, while the social worlds they reflect have not’ (2020: 6)
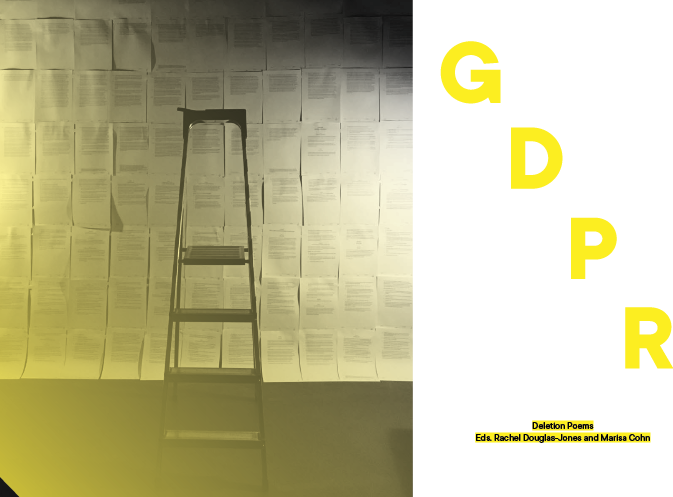
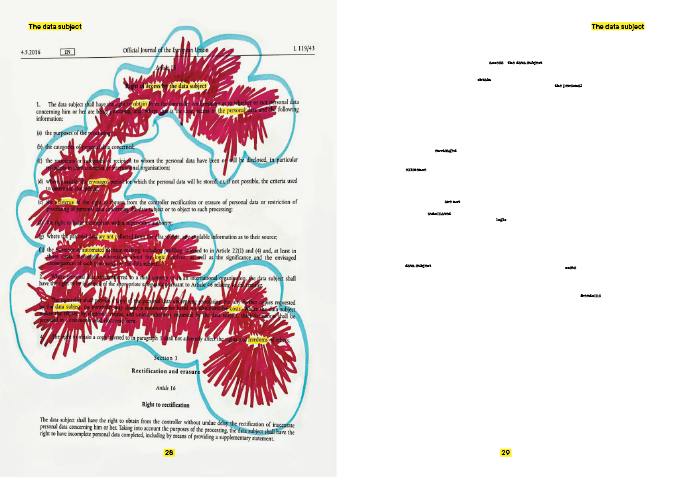
Figs 10.3 and 10.4 Two pages from Douglas-Jones and Cohn 2018 GDPR Poems showing the process of making erasure poems from the GDPR in Copenhagen, and a sample poem.
A reflection of the changing social worlds of our research in STS is for instance visible through the interactive exhibition ‘Making and Doing’ which, since the conference in Denver 2015, has made up part of the 4S’ (Society for the Social Studies of Science) annual meetings. The exhibition and surrounding work foregrounds what happens when, as Downey and Zuiderent-Jerak put it, we turn ‘STS lessons into STS work’ (2017:223). Its 2015 motto – Visual and Sensory Approaches – encouraged reflections on arts in science, on imagination in scientific processes, and on science as a vehicle for artistic production of objects (Le Bot and Noel 2016: np). A forthcoming book on experimenting with ethnography is indicative of a growing interest to engage with various methodologies, media and materialities (Ballestero and Winthereik 2021). For instance, one of the contributions proposes the production and methodological use of postcards – similar to Visual Vignettes – as katachresis to gain new insights and generate new themes (Dányi, Suchman and Watts 2021). Gugganig and Schor (2020a; 2020b) similarly highlight the pedagogical and multimodal ethnographic potentials in/of/as postcards. Putting research forms and formats under contemporary scrutiny, we find ourselves part of a growing conversation about STS’ various knowledge practices, dependencies and distributions, whether that be individualized models of production (Colleex 2020), the development of languages and practices of collaboration (Liboiron et al. 2017) or reconsiderations of the standard template of text-b(i)ased articles and books (see for instance Bauer et al. 2020).
Returning to Gugganig’s visual analogy of a house under (re)construction to unravel the making of academic work, we can now see its double provocation. The story of (re)construction focuses our attention on processual aspects of research in the making and, as an object in itself, shows us how we can find ways to tell our research stories differently. Making a Visual Vignette demands this double attention: to process – both of research, and to the making of a Visual Vignette – and a thorough engagement with elements of a story. Learning to both create and speak through another set of tools becomes the task of the researcher engaging a new format: to ‘value their work in progress; to reveal their workings; to render visible their meaning making’ (Jungnickel 2020: ix; Chio 2017). As we go on to show below, research infrastructures, like any infrastructure, are ‘things and also the relation between things’ (Larkin 2013: 329). As things, our research formats channel and guide our thought: they are made and remade, they leak, break, get fixed. As relations between things, such as researchers and their collaborators and audiences, they may get repurposed. Thus, to make Visual Vignettes about sensor practices is to think simultaneously about the capacities of the sensing researcher, the sensing they wish to portray, and the stories the format makes possible.
Visual Vignettes: Sensing and sensemaking
Visual Vignettes encourage the re-imagining of the role of text and visuals in sensemaking (see Pink 2011). In our work with the format over the past few years, we held workshops in Copenhagen and Munich introducing the idea to students with field material in hand.1 In the workshops, we explained that while a vignette usually relates to written words only, and a photo essay uses images, mostly photos, in well-placed sections within a written text to illustrate said text, the Visual Vignette requires working with both together. At first, many hesitated at the threshold of the visual. Some presumed they have few capacities to doing arts-based research and/or dissemination, or did not consider themselves as ‘artists’ for that matter. Yet it was our explicit goal, also for the contributors in this book, to encourage those with little to no experiences to experiment with text-image relations. In times where camera-equipped smart-phones have become omnipresent gadgets in everyday life and contemporary research sites, students and researchers amass vast amounts of visual material they often struggle to know what to do with (Rueß 2019).2
The making of a Visual Vignette requires its author to challenge the order and ‘division of labour’ between words – often as descriptor – and images – as illustration. We here follow Sarah Pink, in that ‘it seems more profitable to seek to explore the synergies and connections between writing and images [rather] than in terms of binary oppositions’ (2011: 267). As such, introducing a notion of craft is to reference not mastery, but a sense of curiosity and willingness to experiment. For instance, a frequent comment among workshop participants was that re-approaching their research through its visual components often opened up new dimensions and themes they previously had not been aware of (Kuen 2019). This inversion work – giving the visual components the same explanatory ‘authority’ as the written text – is akin to the ‘writerly craft’, that is, the practice of thinking or writing in images (Paper Boat Collective 2017: 17), but also the other way round, an imagery craft of ‘visioning’ in the form of text. Rather than expecting mastery of self-described visual artists, making Visual Vignettes is more akin to the conception of writing as craft (Paper Boat Collective 2017: 16).
For instance, in Mayer and Shah’s contribution to this volume, Human Sensors, a reader grasps in a single page a point of generative (staged) disagreement between the authors over whether ‘psychic espionage’ ‘works’ (see Fig. 10.5). The text deepens a reader’s understanding of perception, while the placement of the dialogue amongst a set of classified images and coded, redacted documents, places the topic within an imaginary of secrecy. Text does work both as illustrator and as descriptor, as Mayer and Shah work with the challenge of differentiating between technical and human sensors. Elsewhere in the Visual Vignette, text is used sharply: ‘there are no oracles without bards, no human sensors without fusion centers of calculation or committees of interpretation’ they write, alongside powerful, complex collages juxtaposing data, identification, security and threat. Deployed in the context of doubt (in/security) in the senses, the immersive character of the extract from Mayer and Shah’s Visual Vignette affords new curiosities on the part of the viewer. The eye tries to zoom in: can the redactions be detected? The overview is contemplated: can the classified codes and ‘seas of information’ be thought together?
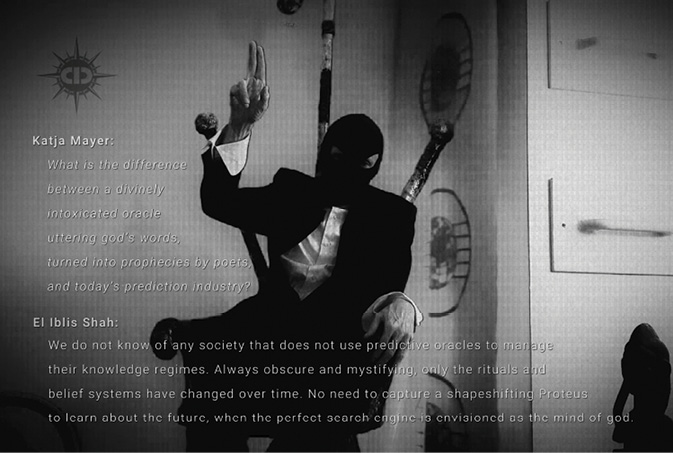
Fig. 10.5 Mayer and Shah (see contribution in this book) play with, and thereby invert the conceptual role of text as illustrator and text as descriptor by merging them in this frame.
The technology for making Visual Vignettes had to be accessible and familiar to academics, so we opted for PowerPoint, or its open source equivalent. Using software known for its familiar ‘boring’ looks prompts an immediate confrontation with the meanings already embedded in the aesthetic (Tufte 2003). Indeed, Tufte argues that ‘popular PowerPoint templates (ready-made designs) usually weaken verbal and spatial reasoning’ (2003: 3). Anthropologist Marilyn Strathern cuttingly remarks that bullet points (all too frequently seen on PowerPoint presentations) offer no sequence, no ‘internal relations’, allowing no growth, and creating no knowledge (2006: 196). When we are forced to see the document rather than the text (Strathern 2006: 184) as part of a critical engagement with the givens of PowerPoint, the format opens up. What can the document do?
To create a series of images, a sequence, that conveys meaning rapidly, whilst providing something substantial to think through, is difficult. In Wood’s Visual Vignette A Trail of Breadcrumbs (this volume) we see multiple voices, from different times, presented together. No bullet points. Fieldnotes and pencil drawings sit alongside photos of GPS sensors, screen-shots of tracking devices and accounts of workshops taking place outside. In this way, Wood takes us into the world of the Global Positioning System, from satellites to monitoring stations and buildings that disrupt reception. With him, we visit London to consider in the company of his workshop participants – just what goes into the charismatic little blue dot on a GPS-enabled phone. Hand drawn diagrams from the workshops bring forward the concerns that participants had about where in such an infrastructure ‘watching’ might take place. Eyes hover around different slides and parts of the drawing, with satellites taking on the qualities of a knower. What can the document do? Wood ends his Visual Vignette with an invitation to his colleagues in STS to copy these techniques of drawing and workshop feedback, to ‘use careful, affect-driven staging borrowed from artistic practice to catalyse participant reflection’ and learn more. The vignette thus not only documents the workshop and its creative outputs, it produces an opportunity for Wood to invite others to experiment with these techniques.
Working with new formats creates new kinds of constraints. In their Visual Vignette Parasitic Surveillence Evan Light and Fenwick McKelvey take us on a walk through the Canadian city of Toronto. In a few short frames, Light and McKelvey introduce us to three layers of communications infrastructure: everyday mobile infrastructure, the surveilling devices parasitic upon this mobile infrastructure known as International Mobile Subscriber Identity catchers (or more charismatically, StingRays), and then SITCH, the open-source tool for detecting these parasitic IMSI catchers. Walking the city with a mobile device, they tell us, is an experience invisibly mediated. Their research with SITCH aims to make the parasitic, invisible StingRays visible. Light and McKelvey introduce us to their maps, routes, views, and to the #stingray_msg data flowing down their screens, producing a powerfully layered story (Fig. 10.6). All of this is presented through the format of a Visual Vignette. From the images we learn both the politics and practicalities of finding StingRays – the contingencies of reading ‘data-space’ (Mattern 2016) and methods for walking the city. The Visual Vignette is full of reference to the senses – the smell and taste of mushrooms, the texture of a crevasse in a wall, perhaps even the sound of StingRays (fictionally) overheard. Images do the work of connecting physical devices to declassification documents, and to alerts on a screen, letting the viewer’s own ‘knowledge-seeking strategies’ (Favero 2017: 361, see also Färber 2007) move between text and image. The reader follows Light and McKelvey’s walk through the city, encountering the non-human inhabitants of urban landscapes through the intersection of word and image, with city skylines, code and boxes drawing us into the data-scape of what the authors term parasitic surveillance. By not relegating images to the margins, readers gain a more visceral sense of the work it takes to find and identify parasitic devices.

Fig. 10.6 Meeting the StingRays in Light and McKelvey’s Visual Vignette through layered image and text.
Working with Visual Vignettes
We initially conceived Visual Vignettes as having a role in dissemination of research, taking place late in a project to communicate research findings. We saw them as useful tools for ethnographers to bring with them on return field visits, material objects to be shared with people with whom they had worked (see Fig. 10.8). Visual vignettes can, for example, be printed and hung in departmental hallways, offices, galleries and cafes in field-sites or university towns, printed on durable materials as street art, made into banners, and so on (see Fig. 10.9 and 10.10). Short, and requiring succinct synthesis on the part of the author, they can make incisive interventions into existing debates. Facing academia, they can be displayed digitally on blogs and department websites (see STS Infrastructures 2019), or exhibited on a curated website (Visual Vignettes 2018). In this communicative ambition, the Visual Vignette shares what Kat Jungnickel puts forward as ‘tactics of transmission’: a critical combination of making and communicating through inventive dissemination (2020: 7).
However, in our workshops students and participants brought material at all stages of their research projects. Some work was simply not ready to be transmitted or disseminated, or was never meant to be. As such, we explored with them what the making of a Visual Vignette might do for them during fieldwork, or early in analysis, and found the format amenable to adaptation as an ‘infrastructure of inquiry’ (Estallella and Criado 2017). In what follows, we briefly present the Visual Vignette as a generative mode of research work in three, interrelated ways: (1) for organizing ideas; (2) analysing data; (3) sharing research. What might be gained by seeing them as an infrastructure for sensing in and of themselves?
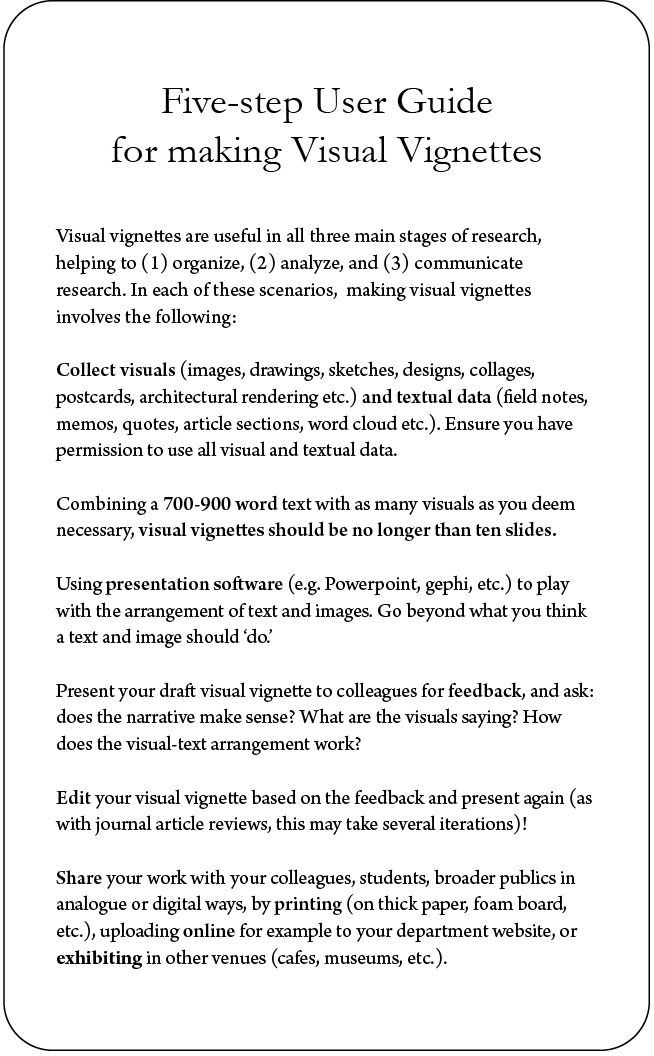
Fig.10.7 A five-step user guide for making a Visual Vignette.
Fieldwork: Thinking and sensing in the field
Ethnographic researchers today go into their field sites with a great many image-making devices, often encountering environments that are full of others making images too (Beuving 2017). A Visual Vignette can highlight to the researcher the process of research: making and remaking of images through recording and editing can be ‘catalysts that encourage researchers and students to reflect upon where they stand, with whom, and how’ (Boudreault-Fournier 2017: 71). In this form, the Visual Vignette keeps company with fieldnotes, a well-elaborated component of ethnographic work and field methods. ‘Inventive’ methods today are thought of as
tools, instruments, techniques or distinct (material-semiotic) entities that are […] able to be used in multiple contexts and continually introduced into new one… oriented towards making a difference (Lury and Wakeford 2012: 10–11).
To make a Visual Vignette during research is to sort through and select images of significance, to explore what makes a difference. Its limited format allows for the juxtaposition of words and images, and reminds the researcher of the breadth of their senses. Whilst we may now have devices ‘to hand’ in the field (Favero and Theunissen 2018), their ubiquity both makes image-making a more commonplace activity and one with additional politics of circulation (see Dattatreyan and Marrero-Guillamón 2019). The Visual Vignette might be a space that an ethnographer could gather together different types of images they are encountering, from the ones they themselves produce to those that they sent, to images present in materials that they work with. Rather than separating the research phase from the demonstration and communication of its ‘end product’, that in more conventional terms would be an essay or thesis, creating this ‘end product’ during fieldwork becomes an integral part of the practice of doing multimodal research (see Collins et al. 2017).
Analysis: Making sense
When field research comes to an end, it is often challenging to begin to work with all that has been gathered. Since a textual endpoint is what most of us work towards (a PhD dissertation, an article, a book), we are drawn to the texts in our material: interview data, things people have said, our own notes from the field. But since writing is more than putting words on a page, we can use its wider character of reflective practice to work beyond words themselves. This is a familiar technique within STS. In his 2007 essay ‘Pinboards and Books: learning, materiality and juxtaposition’, John Law puts forward a ‘pin board method’ for knowing what he calls ‘non-coherent realities’. His technique is designed to make visible ‘mutual irreducibility’ as well as help the ethnographer see relations. In this stage of research, the Visual Vignette also shifts the focus from words to images. It requires a fieldworker to go back through an (often large) archive of visuals and spend time sorting, thinking. What stories can begin to be told within the constraints of the Visual Vignette? How will words and images work in tension or in dialogue before a story is fully clear to the researcher themselves? How stories are told, how they are assembled and put together, requires considerable time and reflection, not least on the question for whom they are being told. They are powerful, and political (Latour 1988; Watts 2016, 2017). A Visual Vignette in this context might also help an STS ethnographer summarize the approaches she has made in the field in the form of her methods. With an increased attention to how STS researchers create their data (Hyysalo et al. 2019, Lippert and Douglas-Jones 2019), the Visual Vignette can assist the researcher in reflexively narrating classical problems, such as their positionality in the field, the senses they used in collecting their data, and the role of the visual in the field itself.
‘Stories give us hints as to how they need to be written’, write the collaborating authors of the Paper Boat Collective (2017: 11), and participants in Visual Vignette workshops observed that ‘regular academic work’ would ordinarily exclude their photographs (Rueß 2019).
Sharing: Stories on the move
As material objects, Visual Vignettes can help stories travel: they become part of the ongoing relation between researchers and their audiences. Collins and Durington (2015) distinguish between sharing and disseminating research. For them, the difference is a matter of how open one is to dialogue, interpretation, disagreement and counter examples that might arise during field-based engagement with research findings. Building on principles of professional responsibility formulated by the American Anthropological Association, they point out that ‘in a world of digitized fungible information that can be ported across media flows’, the association admits that an ethnographer cannot control how work is interpreted, re-contextualized or made meaningful (Collins and Durington 2015: 55). STS researchers can build on this knowledge to consider the settings wherein their analyses might be put to work. Printing turns a vignette into an object to circulate, to be taken to the field, used as a prompt for discussion. As scholars in visual and multimodal anthropology have noted, the work of the visual can be to create and keep open channels of discussion between researchers and those with whom they have shared their lives (Collins et al. 2017; Cooper 2008; Ruby 2000). Termed ‘multimodality’ in anthropology, the door has opened for more voices and media ecologies (words, graphics, images, film, installations, etc.) to constitute academic engagement and creativity (Collins et al. 2017). Collins and his colleagues are optimistic about the ‘democratization potential’ of media production to support more foundationally collaborative research, and expand the scope for relations between researchers and communities in the ‘afterlife’ of research projects (2017: 142). Indeed, this interrelatedness of the three modes of research work presented here, as well as the students’ experiences in the workshop, illustrate this multimodal approach, encompassing – rather than separating – research, the production of media for dissemination, its afterlife, as well as the relationships and discussions engendered through these processes (Collins et al. 2017: 142). Such after-lives might take the form of printed Visual Vignettes, turned into a fold-out postcard series (Figure 10.8), posters, or an exhibition (Figure 10.9).
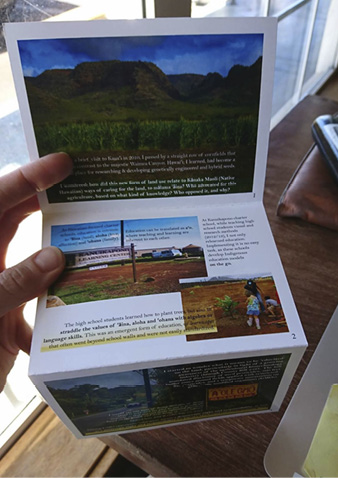
Fig. 10.8 Visual vignette as three-fold in postcard size for dissemination among research participants (Gugganig 2019).
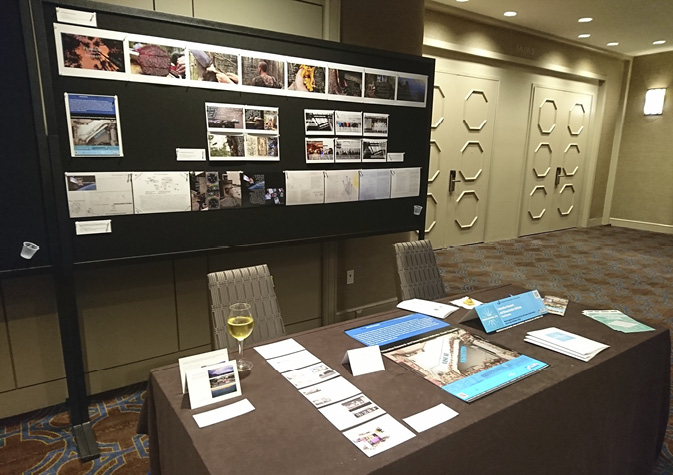
Fig. 10.9 Display of Visual Vignettes by Mascha Gugganig, Laura Kuen, Felix Remter, Anja Rueß, Luise Ruge and Chris Wood (in alphabetic order) at the ‘STS Infrastructures’ exhibition, 4s meeting in New Orleans (2019).
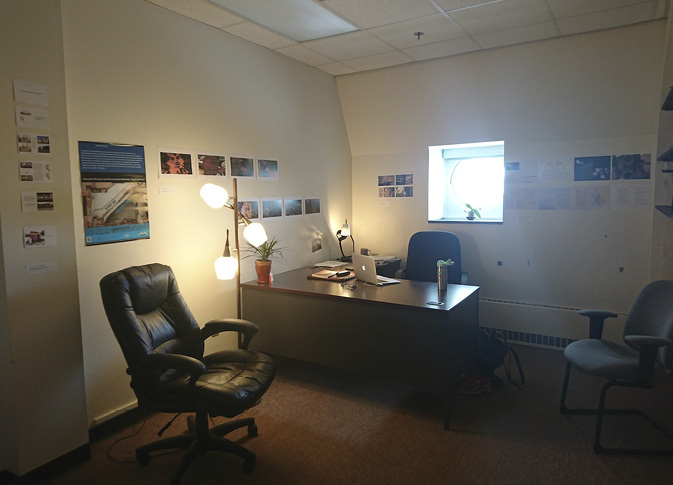
Fig. 10.10 Office space decoration, Cornell University.
In this mode of making a Visual Vignette, audience matters. Whereas in the prior modes of working with Visual Vignettes for fieldnotes and analysis, one’s audience was largely oneself, here, stories are being told outwards (even within an office space, see Figure 10.10). For display or discussion, the Visual Vignette communicates. STS researchers often operate in scientific knowledge regimes, and, as a result have many different relationships to their fields. Not all fields will feel ‘appropriate’ to Visual Vignettes as a communication of research findings. If this is the case, there are interesting questions to ask about why not. What is there about the visual that resists reception? What knowledge hierarchies are in place that render the Visual Vignette format inadmissible (see Chio 2017; Star 1995)? Some fields may be highly receptive, already operating in an economy of images, with active science communication arms and social media editors. Perhaps here, the story of a Visual Vignette might subvert an accepted narrative about a device, system or technology.
Whether a visually saturated field or not, introducing Visual Vignettes into field discussions has the power to shape debate. Bringing material objects, created from the field, performs research differently, and may construct new field openings or make visible realities previously unseen. Thinking with and through these field engagements demands close reflection on field accountabilities and questions of ethics as part of critical research practice. STS research may have much to discover beyond the research paper format, beyond the PowerPoint, and its bullets.
Conclusion
Rendering sensor stories as Visual Vignettes brings novel forms of research communication into conversation with novel forms of sensing. Finding ways to communicate about our wired, and wireless world is a task of demonstrating the mutual co-constitution of security and insecurity. As they come into being alongside one another in our field-sites, STS scholars use their analytical apparatus and their senses of listening and seeing to make this mutual emergence visible. These affordances work well for STS, as ‘new collaborative and collective ways of sensing materialize that contribute to distinct and transformed worlds’, even ‘sensing otherwise’ (Gabrys 2019:733). Our methods shape how we see, as do our tools of analysis (Ballestero and Winthereik forthcoming). The Visual Vignettes in this collection bring forward forms of analysis that demonstrate the potentials of working with images alongside text, to stay with the dissonance produced when a conventional tool (PowerPoint) is pressed into alternative, imaginative use. In their skilled creation and interpretive richness, these Visual Vignettes create new audiences for the sensing stories their authors wish to tell while emphasizing sensing practices in our empirical fields.